
Is a thriving team of business analytics specialists equipped with the right tools Is a thriving team of business analytics specialists equipped with the right tools enough for organizations to realize the potential of the data they collect? Certainly, for many companies, it is one of the key elements of their culture of working with data. However, it rarely proves to be enough to make meaningful decisions based on the full spectrum of available data.
You already have the data, but what about access to it?
This is because the results of analysis are often lost in the maze of information and issues coming to decision-makers. This results in the fact that still in many cases managers make decisions based on hunches and a limited fragment of available knowledge. Given that the knowledge they need is often already in the organization, but they themselves do not have convenient access to it, one can speak of a kind of waste of resources.
The issue discussed above relates to the broad area of data availability and the analytics built on it, as well as collaboration in this area. It is often the case that organizations pay too little attention to the area of business analytics. Thus, they prevent the efficient internal distribution of data and the knowledge generated from it.
Focusing solely on expanding analytical resources without paying attention to how knowledge will be shared with target audiences can be compared to creating a massive factory without road access and all logistics. Knowledge generation is of no use if the organization does not adopt a proper strategy for sharing and collaborating in the area of data and analytics.
How to enable the flow of data and knowledge in an organization?
It’s difficult to point to a single factor that will cause all members of an organization to start using data and analytics to support their work and decision-making. Rather, we can speak of a set of elements that make up the entire data culture of an enterprise, where team members’ attitudes, organizational habits, division of roles and responsibilities make working with data a habit – regardless of position. An organization that succeeds with business analytics needs the right technical foundation, removing common obstacles to accessing analytical resources.
The fundamental elements that allow such a culture of working with data to flourish are the right tools. They allow access to data, perform analysis, share it with security, and enable collaboration among team members. Many companies try to meet these needs by combining several available tools. The most common tools for sharing results are software for creating reports and multimedia presentations, or reporting modules in various platforms. These are used to manage individual business areas. However, this is not all that business analytics has to offer.
Are you basing it on up-to-date data?
The undoubted disadvantage is the static nature of these solutions. Additional questions and concerns that arise from the audience require the involvement of analysts to develop another report or presentation. This can significantly delay the process of providing answers to even simple questions. In a rapidly changing reality, can organizations afford to make decisions based on data from a week or a month ago?
One step further are companies that work with BI tools that have dedicated functionality for this purpose. However, they often use them to control current processes by creating static dashboards with rigidly defined metrics. In doing so, they have limited ability to ask follow-up questions and deepen their analysis on an ongoing basis.
What solution, then, can be used to unlock the potential of data on an organization-wide scale?
Tableau – business analytics and team communication
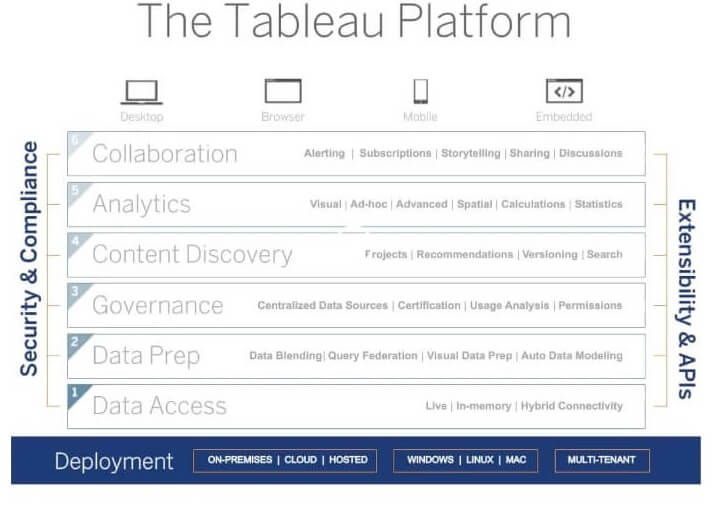
With the answer to this question comes Tableau as a powerful platform covering the entire range of analytical needs of enterprises. It covers the full area of working with data from managing the sources of data, to conducting analysis, to the module for managing the availability and visibility of relevant source data, visualizations, dashboards or entire “Stories”, i.e. linear narratives built on data.
With Tableau, every member of the organization can have access to visualizations powered by real-time data. He or she can expand them almost at will with his or her own analyses on connected data sources, and then share them with other users. Communication is facilitated by built-in features. These are used to add annotations, change display parameters, intelligently filter content and notify of new visualizations from areas of interest.
Safety first
Data processing is a particularly sensitive area from a security perspective. Organizations need to ensure that their resources are protected from outside intrusion and that they have the appropriate internal disposition of data access privileges. Tableau can run on internal servers, as part of a cloud infrastructure from a third-party provider, or in the secure Tableau Online cloud. It all depends on the size of the organization and its security policies. Internal data management is done in the platform itself. Each data source and visualization can be made available to the entire organization or subject to user-level access restrictions.
How to take advantage of these opportunities
Imagine how much more effective meetings and teleconferences would be, where participants – instead of recalling that “somewhere they once saw a report according to which a year ago the phenomenon under discussion affected 40% or maybe even 50% of our customers” – could look at the very source of knowledge and verify the hypothesis with the latest available data, see how it actually was a year ago, and then see what else distinguishes the studied group of customers. How much will the confidence and effectiveness of decision-making increase if managers have ongoing access to information and strategic insights?
Relevant decisions will be made much faster if end users do not have to submit simple questions to analysts, being able to answer them themselves using an intuitive interface, and the most important information about the current and historical status of business processes is always available online on the screen of a laptop or smartphone.
Convenient and intuitive access to data and business analytics is an invaluable benefit on an organization-wide level. It enables you to change management and make key decisions based on measuring business process results, data-driven insights and observable facts.
You can read our previous article on business analytics and Tableau here.
Let’s talk about business analytics and Tableau implementation in your company – contact us!
You can also go to the main Tableau website.
Article written by Matthew Gemra.

")


